Portfolio after fees and tax
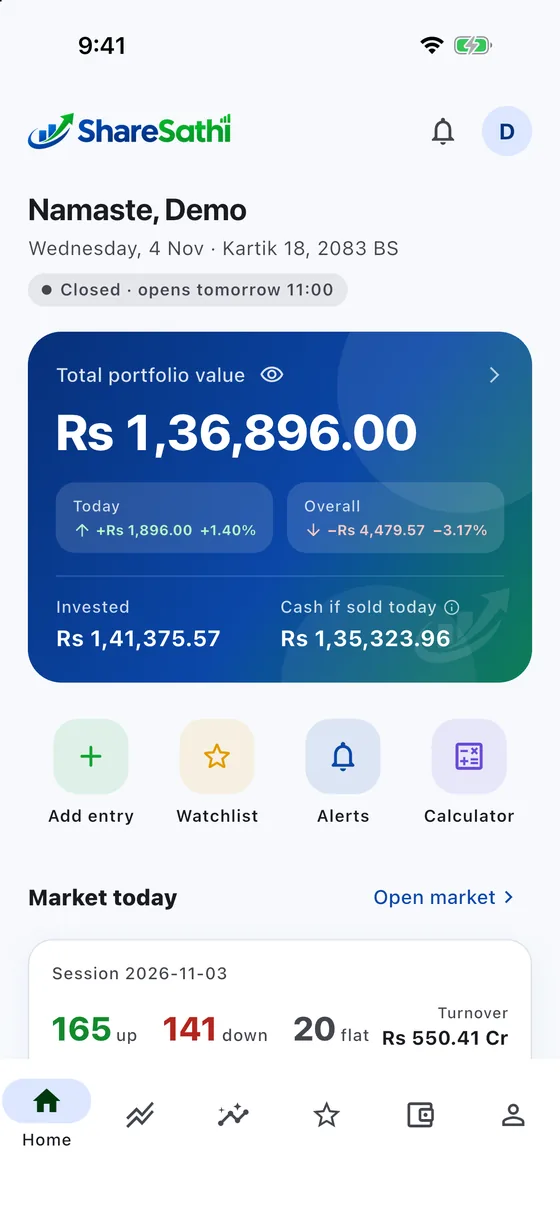
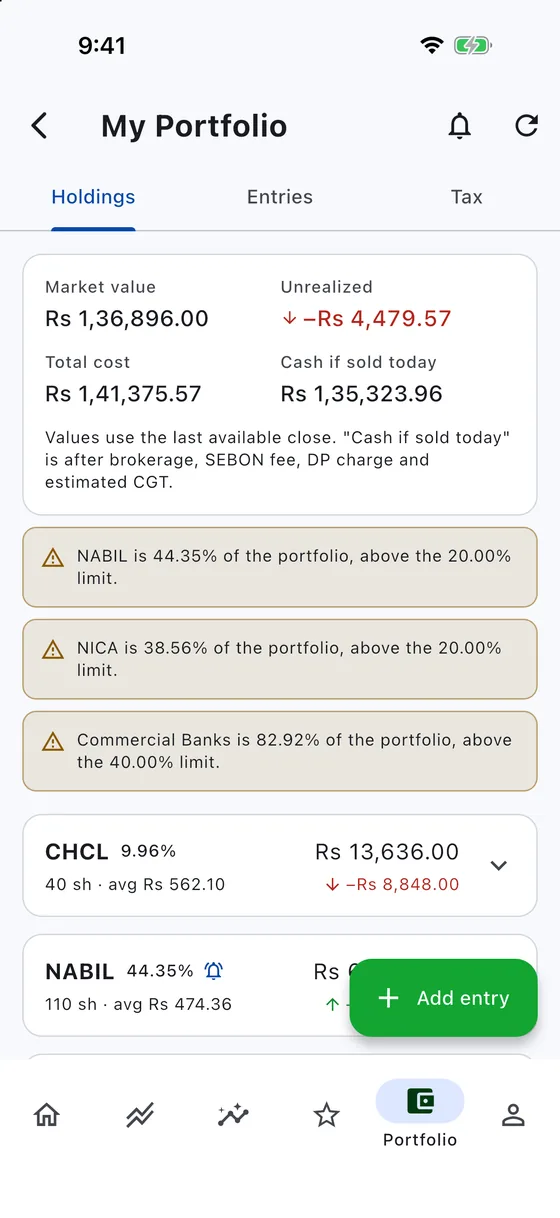
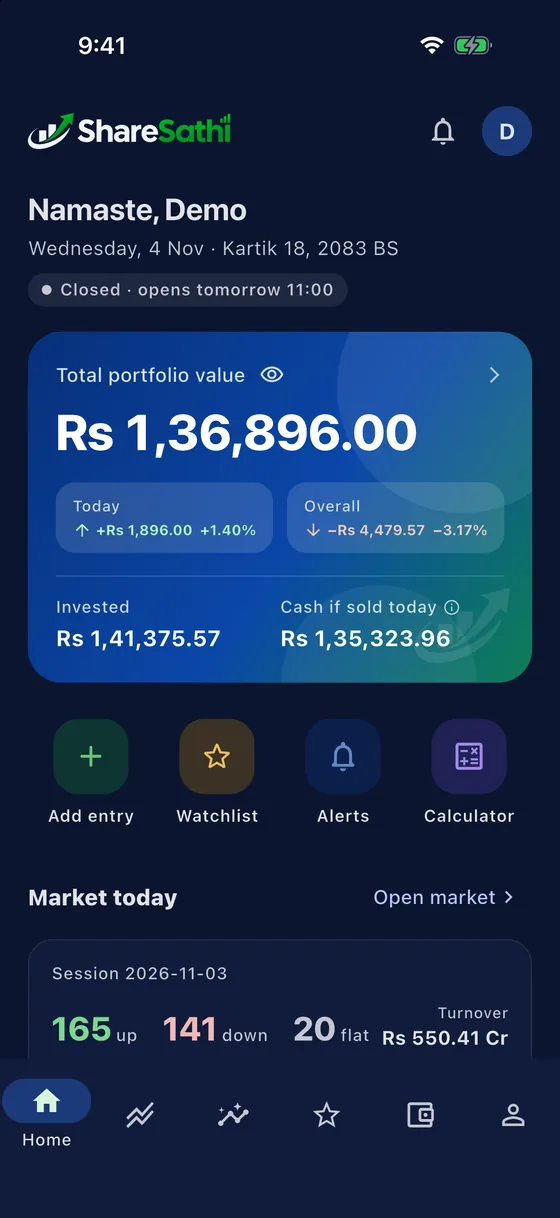
Add buys, sells, IPO allotments, right and bonus shares, cash dividends and mergers. See market value, gain, and the cash you would get if you sold today after every charge.


ShareSathi tracks your NEPSE portfolio the way your broker bill does: brokerage, SEBON fee, DP charge and capital gains tax included. Set take-profit and stop-loss levels and get a notification when the price gets there.
Closing prices shown in the app · session 3 Nov 2026 · Kartik 17, 2083 BS
Built around how the Nepal market actually works: T+2 settlement, the daily price limit, bonus and right shares, and the 365-day CGT rule.
Add buys, sells, IPO allotments, right and bonus shares, cash dividends and mergers. See market value, gain, and the cash you would get if you sold today after every charge.
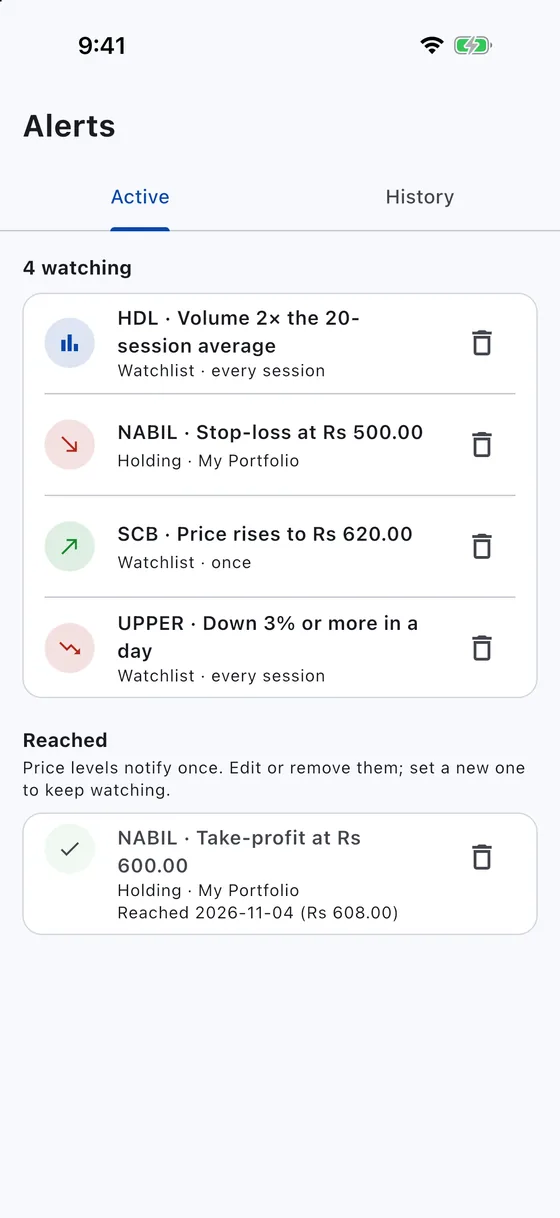
Set levels when you add a stock or any time after. You get a phone notification the moment a new price crosses them, and each level fires once.
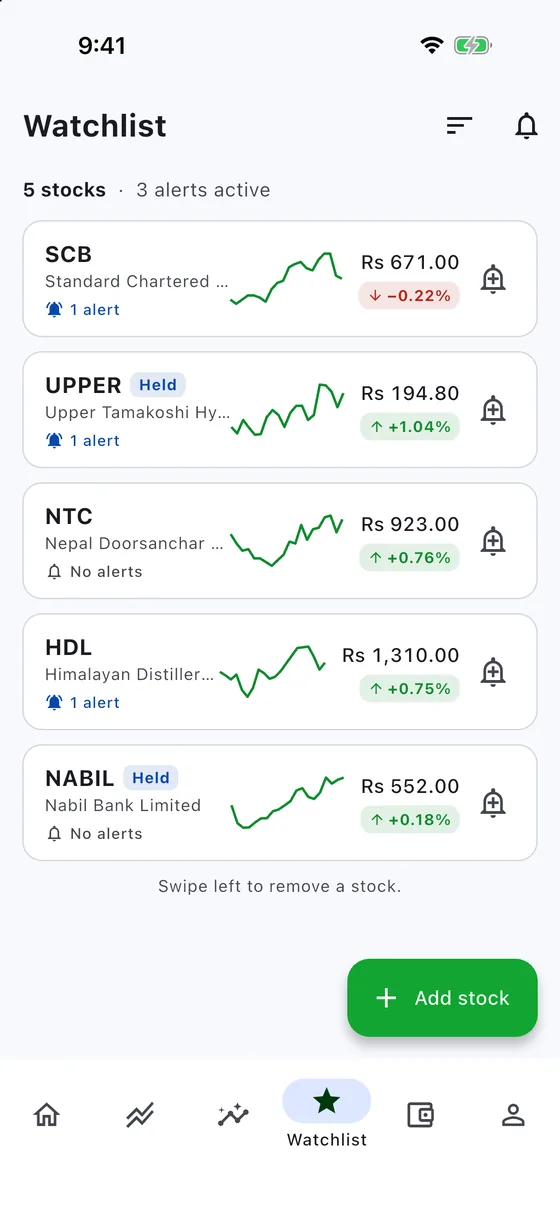
Follow any stock with a 20-day trend line. Get alerted when a price rises or falls to your level, on a big daily move, or when volume jumps to several times normal.
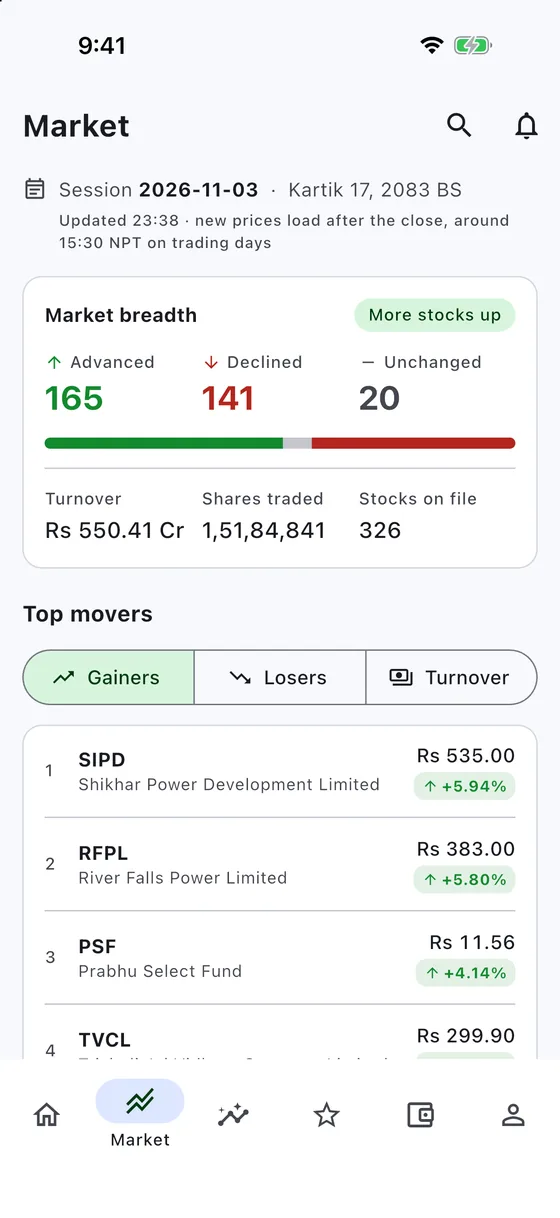
Advancers and decliners, turnover, top gainers and losers, stocks at the ±15% limit, and how each sector moved, for every trading session.
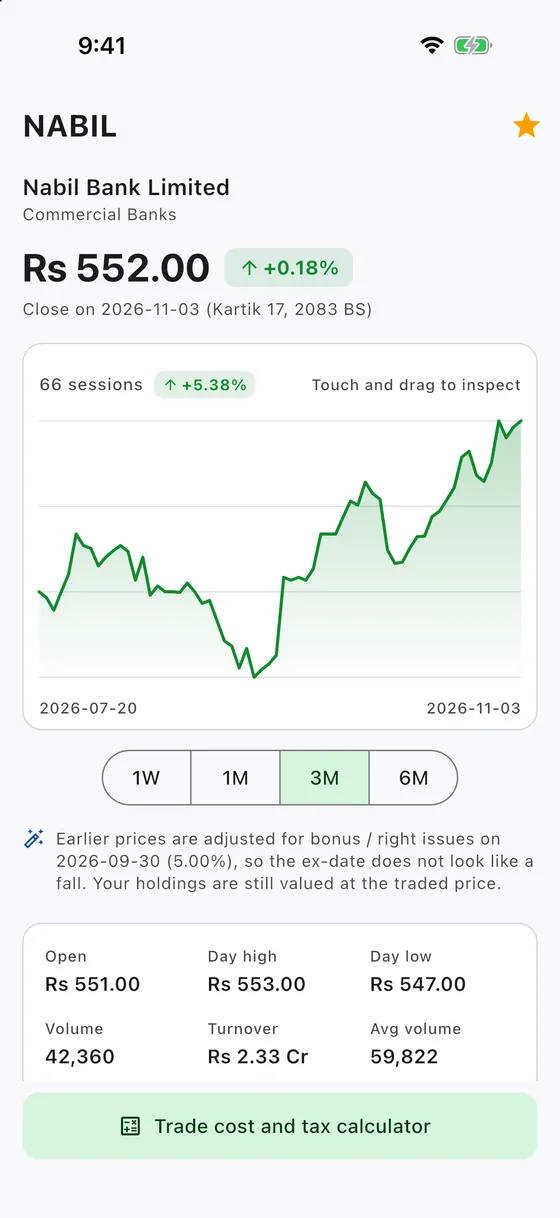
Price history you can scrub with a finger, day range, volume and turnover. Earlier prices are adjusted for bonus and right issues, so an ex-date never looks like a crash.
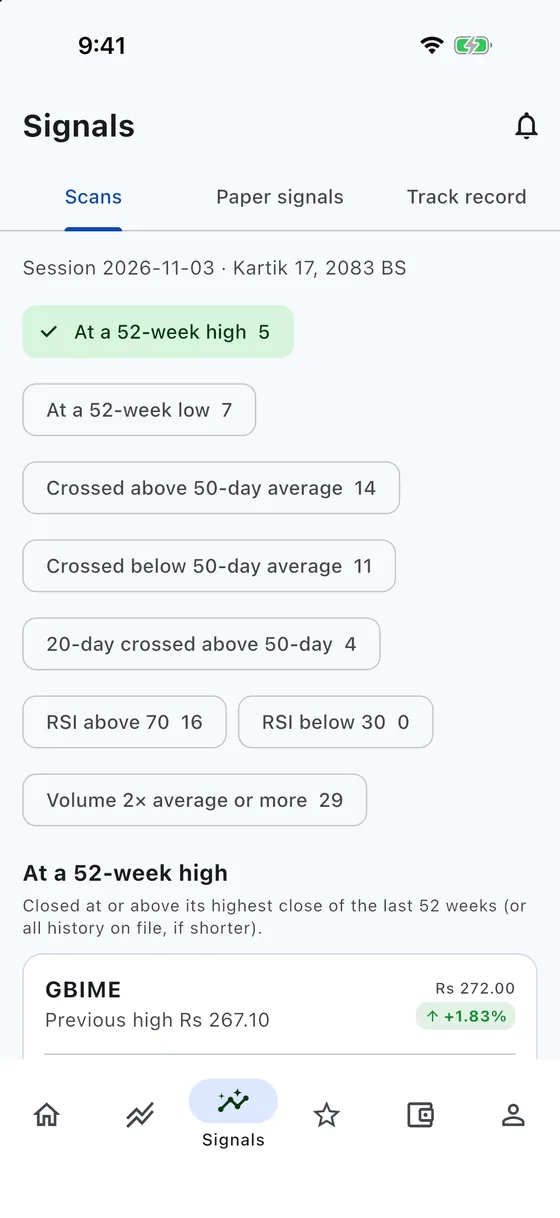
52-week highs and lows, crosses of the 50-day average, RSI above 70 or below 30, and volume surges. Scans describe what prices did; they do not tell you to buy or sell.
See when shares cross 365 days and qualify for the lower long-term rate, and roughly how much tax waiting would save at today’s price.
Enter a quantity and prices to see brokerage, SEBON fee, DP charge, CGT, net profit and break-even price, using the rules in force on each date.
Buy 100 shares at Rs 1,200 and sell at Rs 1,350 eight months later. The price moved Rs 15,000, but brokerage, the SEBON fee, the DP charge and capital gains tax take their share. ShareSathi shows the number you actually keep.
Rates come from dated rule tables, so an old entry uses the rules of its own date.
| Item | Buy | Sell |
|---|---|---|
| Trade value | 1,20,000.00 | 1,35,000.00 |
| Brokerage | 396.00 | 445.50 |
| SEBON fee | 18.00 | 20.25 |
| DP charge | — | 25.00 |
| You pay / receive | 1,20,414.00 | 1,34,509.25 |
| Capital gains tax (10%) | 1,409.53 | |
| Net profit | Rs 12,685.72 |
Real screens from ShareSathi on iPhone. Swipe or scroll sideways for more.
ShareSathi never asks for your TMS, MeroShare or bank passwords. You add your entries yourself.
Amounts are worked out to the paisa with whole-number arithmetic, not rounded estimates.
A missing price is shown as missing. Charts are adjusted for bonus and right issues and say so.
Scans describe what happened. Buy and sell signals stay off until they are proven and reviewed.
No. ShareSathi is a tracking and research app. You trade through your broker as usual and record your entries in the app.
No. ShareSathi shows prices, calculations and factual scans to help you decide for yourself. Check important decisions with your broker or a licensed adviser.
ShareSathi uses end-of-day prices from public market data sources, updated after each trading day. They can be delayed or contain errors, so confirm with your broker or NEPSE before you trade.
They follow the published brokerage bands, SEBON fee, DP charge and CGT rates for each date. Your broker’s bill can differ slightly; you can enter the actual charges from your contract note.
Open Profile in the app and choose Delete account. Your account, portfolios, watchlist and alerts are removed straight away. See the privacy policy for details.